June 14th, 2010
There’s plenty of ‘information’ available in Malaysia, and just a few people publicly questioning its quality. The Ministry of Tourism is conducting a poll on its website to see whether people want to keep the arches being built at the Penang Botanical gardens (Warning: abysmal Flash site). Anil Netto (who isn’t keen on the arches) is worried that the poll may be being manipulated. Specifically, he is concerned that the poll was showing 91% against retaining the arches for some period of time and then suddenly did an ‘about face’ and showed over 50% for retaining the new arches.
Fortunately for busy-bodies, the Motour website uses AJAX to implement its poll, so it’s very simple to run a shell script using something like cURL to keep track of the poll without causing the web server or its admin any undue stress. In case you’re interested, here are some plots using GnuPlot. The time axis is ‘time of day’ where the integer part is the day part of the date (so 13 is 13th June, 14 is 14th June). The decimal part of the day is 2.4 hours per tenth, so 14.4 is the 14th of June, 4 times 2.4 (2 hours 24 minutes) hours = 9:36 in the morning.
Totals – the poll ‘result’:
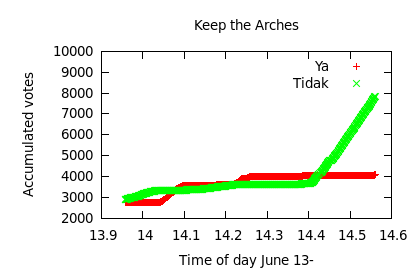
Ministry of Tourism "Keep the Arches" poll / total votes
Shown as a percentage:
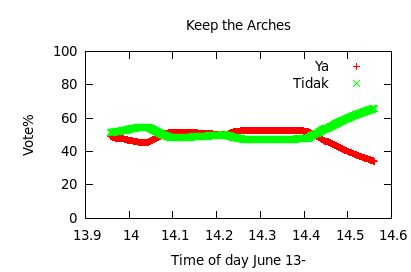
Ministry of Tourism "Keep the Arches" poll / vote percent
And the voting rate as votes per minute – calculated as the difference between one minute’s total and its predecessor.
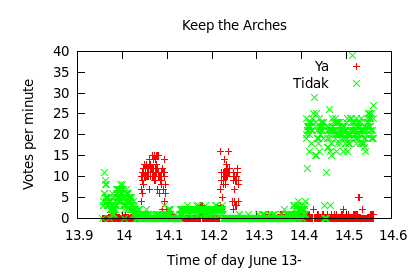
Ministry of Tourism "Keep the Arches" poll / votes per minute
There isn’t really much that can be said about the data. There’s no way of telling – for example – exactly who is voting or even if there is anybody voting more than once. It would be nice to see the raw server logs, though there’s an obvious privacy issue involved in making the IP addresses available. Providing stats based on the network address range – such as that available from the Routing Assets Database – would probably go a long way to allay fears over who is voting – and may even allow stats to be generated based on geographical region.
If anybody is interested, I can provide the raw data from which these plots are made. The AJAX request isn’t always reliable, so there are missing data points – a sequence of 20 (minutes) is currently missing as I write this.
8pm on Monday 14th – a little update. Not sure how many times I’ll do this, perhaps I’ll wait until there’s some ‘remarkable’ change in the poll. The rate chart makes it obvious how ‘episodic’ this poll is! Total:
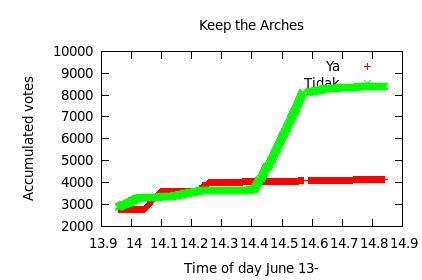
Ministry of Tourism "Keep the Arches" poll / total votes 8pm 14th
Percent:
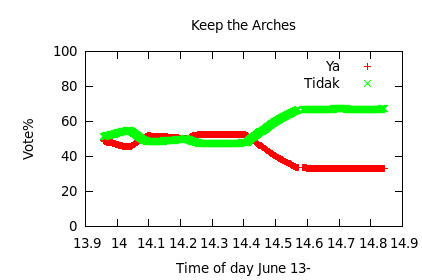
Ministry of Tourism "Keep the Arches" poll / percent votes 8pm 14th
Rate:
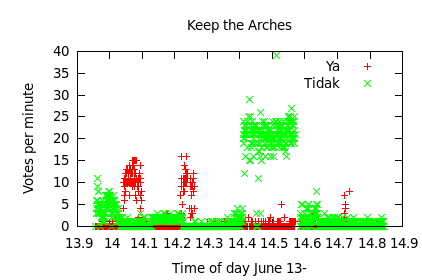
Ministry of Tourism "Keep the Arches" poll / votes per minute 8pm
17:05 – Poll is about to close at 5:30pm, according to MoTour website – I’ll post final graphs after that.
Poll closed – Totals:
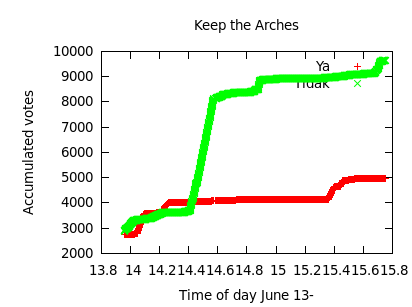
Poll closed - total votes since Jun13
Percent:
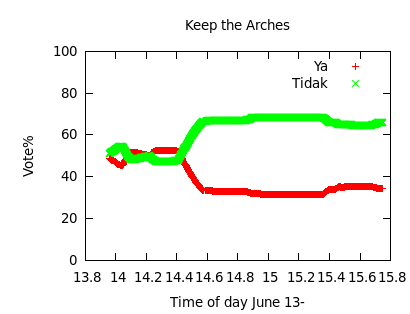
Polls closed - votes percent since Jun13
Votes per minute:
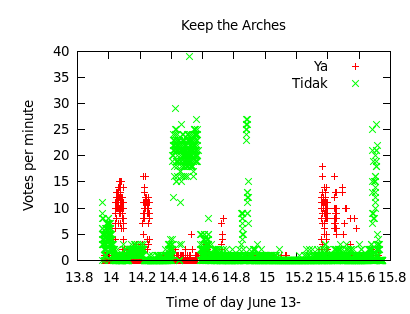
Polls closed - votes per minute last 2 days
The raw data:
Motour logging script raw output – motour.gz
Posted in Bolehtics, Breaktime, FOSS, Life, Philosophy | 2 Comments »


